Directions for questions 84 and 85: Study the aggregate financial ratios of all registered Indian manufacturing companies in the table below to answer the questions that follow.
All figures are as % of net sales unless otherwise mentioned 2000 2001 2002 2003 2004 2005 PBDIT 13.1 11.7 12.3 13.3 14.4 14.7 PBDT 8.1 7.1 8 9.9 11.8 12.7 PBIT 9.4 8.4 8.7 9.9 11 11.6 PAT 3.2 2.8 2.7 4.4 6 6.9 Raw Material expense 41 40.6 43.1 45.5 45.7 47.1 Salaries and wages 5.9 5.7 5.6 5.3 4.9 4.4 Interest payments 4.6 4.3 4 3.1 2.3 1.7 Operating profit 5.2 4.2 4.9 6.7 8 8.7 Net sales (% Growth Over Previous Year) 18.4 19.3 2.6 15.7 15.2 19.9
In which year the annual growth rate in the aggregate Salaries and Wages expense was maximum?
Directions for questions 84 and 85: Study the aggregate financial ratios of all registered Indian manufacturing companies in the table below to answer the questions that follow.
| All figures are as % of net sales unless otherwise mentioned | ||||||
|---|---|---|---|---|---|---|
| 2000 | 2001 | 2002 | 2003 | 2004 | 2005 | |
| PBDIT | 13.1 | 11.7 | 12.3 | 13.3 | 14.4 | 14.7 |
| PBDT | 8.1 | 7.1 | 8 | 9.9 | 11.8 | 12.7 |
| PBIT | 9.4 | 8.4 | 8.7 | 9.9 | 11 | 11.6 |
| PAT | 3.2 | 2.8 | 2.7 | 4.4 | 6 | 6.9 |
| Raw Material expense | 41 | 40.6 | 43.1 | 45.5 | 45.7 | 47.1 |
| Salaries and wages | 5.9 | 5.7 | 5.6 | 5.3 | 4.9 | 4.4 |
| Interest payments | 4.6 | 4.3 | 4 | 3.1 | 2.3 | 1.7 |
| Operating profit | 5.2 | 4.2 | 4.9 | 6.7 | 8 | 8.7 |
| Net sales (% Growth Over Previous Year) | 18.4 | 19.3 | 2.6 | 15.7 | 15.2 | 19.9 |
In which year the annual growth rate in the aggregate Salaries and Wages expense was maximum?
Show Hint
- 2005
- 2004
- 2003
- 2001
The Correct Option is D
Solution and Explanation
Look at the Salaries and wages row: it keeps falling every year, from 5.9% of net sales in 2000 down to 4.4% in 2005. If you only look at this row you might think the aggregate expense was falling too, but that ignores the fact that net sales itself was growing at a healthy rate each year.
To find the real growth of the rupee amount, index net sales to 100 in the base year and roll it forward using the "Net sales (% Growth Over Previous Year)" row, then multiply by the Salaries and Wages ratio for that year:
- 2001: net sales index rises 19.3%, ratio falls from 5.9 to 5.7 (a factor of 0.966). Combined change: $1.193 \times 0.966 - 1 = 15.3\%$.
- 2002: net sales index rises only 2.6%, ratio factor $5.6/5.7 = 0.983$. Combined change: $1.026 \times 0.983 - 1 = 0.8\%$.
- 2003: net sales index rises 15.7%, ratio factor $5.3/5.6=0.946$. Combined: $1.157 \times 0.946 - 1 = 9.5\%$.
- 2004: net sales index rises 15.2%, ratio factor $4.9/5.3=0.925$. Combined: $1.152 \times 0.925 - 1 = 6.5\%$.
- 2005: net sales index rises 19.9%, ratio factor $4.4/4.9=0.898$. Combined: $1.199 \times 0.898 - 1 = 7.7\%$.
The clear winner is 2001 at about 15.3%, well above every other year on this list. So even though the ratio fell the least that year compared to 2000, the strong 19.3% jump in net sales made 2001 the year with the fastest real growth in the aggregate wage bill.
Let's summarize:
- A falling percentage-of-sales ratio does not always mean a falling rupee figure; net sales growth can more than make up for it.
- 2001 combines a strong net sales jump with only a mild fall in the ratio, giving it the highest actual growth in Salaries and Wages.
So the answer is 2001.
Top Questions on Table
- Five restaurants, coded R1, R2, R3, R4 and R5 gave integer ratings to five gig workers – Ullas, Vasu, Waman, Xavier and Yusuf, on a scale of 1 to 5. The means of the ratings given by R1, R2, R3, R4 and R5 were 3.4, 2.2, 3.8, 2.8 and 3.4 respectively.
The summary statistics of these ratings for the five workers is given below.* Range of ratings is defined as the difference between the maximum and minimum ratings awarded to a worker.Ullas Vasu Waman Xavier Yusuf Mean rating 2.2 3.8 3.4 3.6 2.6 Median rating 2 4 4 4 3 Model rating 2 4 5 5 1 and 4 Range of rating 3 3 4 4 3
The following is partial information about ratings of 1 and 5 awarded by the restaurants to the workers.
(a) R1 awarded a rating of 5 to Waman, as did R2 to Xavier, R3 to Waman and Xavier, and R5 to Vasu.
(b) R1 awarded a rating of 1 to Ullas, as did R2 to Waman and Yusuf, and R3 to Yusuf. - Odsville has five firms – Alfloo, Bzygoo, Czechy, Drjbna and Elavalaki. Each of these firms was founded in some year and also closed down a few years later.
Each firm raised Rs. 1 crore in its first and last year of existence. The amount each firm raised every year increased until it reached a maximum, and then decreased until the firm closed down. No firm raised the same amount of money in two consecutive years. Each annual increase and decrease was either by Rs. 1 crore or by Rs. 2 crores.
The table below provides partial information about the five firms.Firm First year of existence Last year of existence Total amount raised (Rs. crores) Alfloo 2009 2016 21 Bzygoo 2012 2015 Czechy 2013 9 Drjbna 2011 2015 10 Elavalaki 2010 13 - Three participants – Akhil, Bimal and Chatur participate in a random draw competition for five days. Every day, each participant randomly picks up a ball numbered between 1 and 9. The number on the ball determines his score on that day. The total score of a participant is the sum of his scores attained in the five days. The total score of a day is the sum of participants’ scores on that day. The 2-day average on a day, except on Day 1, is the average of the total scores of that day and of the previous day. For example, if the total scores of Day 1 and Day 2 are 25 and 20, then the 2-day average on Day 2 is calculated as 22.5. Table 1 gives the 2-day averages for Days 2 through 5.Participants are ranked each day, with the person having the maximum score being awarded the minimum rank (1) on that day. If there is a tie, all participants with the tied score are awarded the best available rank. For example, if on a day Akhil, Bimal, and Chatur score 8, 7 and 7 respectively, then their ranks will be 1, 2 and 2 respectively on that day. These ranks are given in Table 2.
Table 1: 2-day averages for Days through 5 Day 2 Day 3 Day 4 Day 5 15 15.5 16 17 The following information is also known.Table 2 : Ranks of participants on each day Day 1 Day 2 Day 3 Day 4 Day 5 Akhil 1 2 2 3 3 Bimal 2 3 2 1 1 Chatur 3 1 1 2 2
1. Chatur always scores in multiples of 3. His score on Day 2 is the unique highest score in the competition. His minimum score is observed only on Day 1, and it matches Akhil’s score on Day 4.
2. The total score on Day 3 is the same as the total score on Day 4.
3. Bimal’s scores are the same on Day 1 and Day 3. - The table given below shows the amount, in grams, of carbohydrate, protein, fat and all other nutrients, per 100 grams of nutrients in seven foodgrains. The first column shows the foodgrain category and the second column its codename. The table has some missing values.

The following additional facts are known.
1. Both the pseudo-cereals had higher amounts of carbohydrate as well as higher amounts of protein than any millet.
2. Both the cereals had higher amounts of carbohydrate than any pseudo-cereal.
3. All the missing values of carbohydrate amounts (in grams) for all the foodgrains are non zero multiples of 5.
4. All the missing values of protein, fat and other nutrients amounts (in grams) for all the foodgrains are non-zero multiples of 4.
5. P1 contained double the amount of protein that M3 contains. - Want to practice more? Try solving extra ecology questions todayView All Questions
Questions Asked in XAT exam
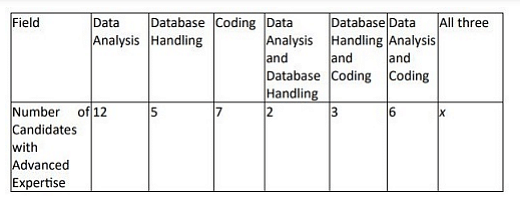
The number of applicants with advanced expertise in all three fields is given as x in the table, where x is a non-negative integer.
- XAT - 2024
- Data Interpretation