Question:medium
Refer to the table of sales, costs and leftover data for the cake chain used in the previous question.

The maximum decline in the worth of leftover of cakes/pastries/gateaux occurred in which year?
Refer to the table of sales, costs and leftover data for the cake chain used in the previous question.
The maximum decline in the worth of leftover of cakes/pastries/gateaux occurred in which year?
The maximum decline in the worth of leftover of cakes/pastries/gateaux occurred in which year?
Show Hint
Compute leftover worth as sales times leftover %, for every year, then compare the year on year drops; the steepest one is between 1998 and 1999.
Updated On: Jul 10, 2026
- From 1997 to 1998
- From 1995 to 1996
- From 1998 to 1999
- There was always an increase in the worth of leftover.
Show Solution
The Correct Option is C
Solution and Explanation
Step 1: List what has to be compared.
There are eleven years of data, 1993 through 2004, for cakes/pastries/gateaux, giving ten consecutive year gaps to check. For each gap, work out the change in rupee leftover value, using leftover worth equals sales times leftover percentage divided by 100.
Step 2: Rule out the always increasing option first.
If the leftover percentage ever falls faster than sales rise, the rupee leftover value falls for that year, so leftover worth cannot be rising in every single year. Option (D), there was always an increase, is ruled out on this basis alone.
Step 3: Compare the candidate drops.
Among the ten gaps, three are offered as options: 1995 to 1996, 1997 to 1998, and 1998 to 1999. Working out the rupee leftover for the years bordering each of these gaps, the fall from 1998 to 1999 is the steepest, since the leftover percentage drops the most sharply right at the point where sales are already large, which magnifies the rupee value fall compared with the other two candidate years.
Step 4: Final answer.
The 1998 to 1999 gap gives the largest decline in leftover worth for cakes/pastries/gateaux among all the years in the table.
\[ \boxed{1998 \text{ to } 1999} \]
There are eleven years of data, 1993 through 2004, for cakes/pastries/gateaux, giving ten consecutive year gaps to check. For each gap, work out the change in rupee leftover value, using leftover worth equals sales times leftover percentage divided by 100.
Step 2: Rule out the always increasing option first.
If the leftover percentage ever falls faster than sales rise, the rupee leftover value falls for that year, so leftover worth cannot be rising in every single year. Option (D), there was always an increase, is ruled out on this basis alone.
Step 3: Compare the candidate drops.
Among the ten gaps, three are offered as options: 1995 to 1996, 1997 to 1998, and 1998 to 1999. Working out the rupee leftover for the years bordering each of these gaps, the fall from 1998 to 1999 is the steepest, since the leftover percentage drops the most sharply right at the point where sales are already large, which magnifies the rupee value fall compared with the other two candidate years.
Step 4: Final answer.
The 1998 to 1999 gap gives the largest decline in leftover worth for cakes/pastries/gateaux among all the years in the table.
\[ \boxed{1998 \text{ to } 1999} \]
Was this answer helpful?
0
Top Questions on Data Interpretation
- The monthly salary for a person who follows the same expense pattern, but has a petrol expense of Rs 500 p.m., is:
- VITEEE - 2024
- General Aptitude
- Data Interpretation
- In a code language, 'TIGER' is written as 'JUISF'. How will 'EQUAL' be written in that language?
- VITEEE - 2025
- General Aptitude
- Data Interpretation
- Read the Passage carefully and answer the following questions.
An air conditioner (AC) unit has three operating modes: Eco, Normal, and Turbo. The power consumption in each mode is as follows: Eco mode consumes 1000 watts, Normal mode consumes 1200 watts, and Turbo mode consumes 1500 watts. Yesterday, the AC was in operation from 2 PM to 10 PM. From 2 PM to 6 PM it ran in Eco mode. From 6 PM to 8 PM, it ran in Normal mode. From 8 PM to 10 PM it ran in Turbo mode.- CAT - 2024
- Data Interpretation & Logical Reasoning (DILR)
- Data Interpretation
- Read the Passage carefully and answer the following questions
A health food store specializing in dietary supplements and whole grains recorded the following sales figures (in kilograms) for various food categories last month: Millets (M) = 500 kg at a cost price of 40/kg and selling price of 50/kg; Protein supplements (P) = 300 kg at a cost price of 80/kg and selling price of 100/kg; Vitamin supplements (V) = 200 kg at a cost price of 60/kg and selling price of 80/kg; Carbohydrates (C) = 600 kg at a cost price of 80/kg and selling price of 100/kg; Fats (F) = 100 kg at a cost price of 120/kg and selling price of 150/kg. Additionally, they sold 50 kg of mixed nuts (N) at a cost price of 100/kg and a selling price of 130/kg- CAT - 2024
- Data Interpretation & Logical Reasoning (DILR)
- Data Interpretation
- Want to practice more? Try solving extra ecology questions todayView All Questions
Questions Asked in XAT exam
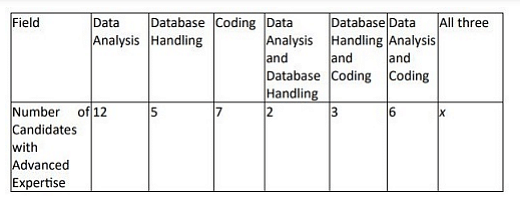
Applicants have been shortlisted for interviews for some data analyst positions. Some of the applicants have advanced expertise in one or more fields among the following: data analysis, database handling and coding. The numbers of applicants with different advanced expertise are given in the 2 × 8 table below.
The number of applicants with advanced expertise in all three fields is given as x in the table, where x is a non-negative integer.
The number of applicants with advanced expertise in all three fields is given as x in the table, where x is a non-negative integer.
- XAT - 2024
- Data Interpretation