Question:hard
Directions for questions 86 to 90: Study the tables of the Indian foreign trade given below to answer the questions.
Principal Commodities\' Import - Weight (%) COMMODITIES 2003-04 2004-05 2005-06 Bulk imports 37.87 39.09 42.56 Pearls, precious & semi-precious stones 9.25 8.80 6.42 Machinery 10.63 10.00 10.94 Project Goods 0.49 0.54 0.57 Others 41.76 41.57 39.51 TOTAL IMPORTS 100.00 100.00 100.00 Total Imports (in Crore of Rupees) 359107.66 501064.54 630526.77
Principal Commodities\' Export - Weight (%) COMMODITIES 2003-04 2004-05 2005-06 Plantations 0.92 0.78 0.71 Agri & allied products 8.39 7.61 7.21 Marine products 2.08 1.60 1.40 Ores & minerals 3.69 5.29 6.02 Leather & mfrs. 3.19 2.89 2.56 Gems & jewellery 16.56 17.29 15.13 Sports goods 0.15 0.12 0.13 Chemicals & related products 15.43 16.00 15.10 Engineering goods 16.41 18.41 18.66 Electronic goods 2.74 2.28 2.18 Project goods 0.09 0.06 0.13 Textiles 18.86 15.16 14.80 Handicrafts 0.70 0.43 0.40 Carpets 0.90 0.75 0.81 Cotton raw incl. waste 0.28 0.10 0.61 Petroleum products 5.54 8.57 11.21 Unclassified exports 4.07 2.66 2.94 GRAND TOTAL 100.00 100.00 100.00 Total Exports in Rupees Crore 293366.75 375339.53 454799.97 US Dollar Exchange Rate 45.9513 44.9315 44.2735
Given that the weight (%) of Petroleum crude and products in the total imports of India is 26.70, 27.87, and 30.87 in the years 2003-04, 2004-05, and 2005-06 respectively. What is the ratio of yearly difference in the export of Petroleum Products and import of Petroleum crude and products, in dollar terms, in the year 2005-06 versus 2004-05?
Directions for questions 86 to 90: Study the tables of the Indian foreign trade given below to answer the questions.
| Principal Commodities\' Import - Weight (%) | |||
|---|---|---|---|
| COMMODITIES | 2003-04 | 2004-05 | 2005-06 |
| Bulk imports | 37.87 | 39.09 | 42.56 |
| Pearls, precious & semi-precious stones | 9.25 | 8.80 | 6.42 |
| Machinery | 10.63 | 10.00 | 10.94 |
| Project Goods | 0.49 | 0.54 | 0.57 |
| Others | 41.76 | 41.57 | 39.51 |
| TOTAL IMPORTS | 100.00 | 100.00 | 100.00 |
| Total Imports (in Crore of Rupees) | 359107.66 | 501064.54 | 630526.77 |
| Principal Commodities\' Export - Weight (%) | |||
|---|---|---|---|
| COMMODITIES | 2003-04 | 2004-05 | 2005-06 |
| Plantations | 0.92 | 0.78 | 0.71 |
| Agri & allied products | 8.39 | 7.61 | 7.21 |
| Marine products | 2.08 | 1.60 | 1.40 |
| Ores & minerals | 3.69 | 5.29 | 6.02 |
| Leather & mfrs. | 3.19 | 2.89 | 2.56 |
| Gems & jewellery | 16.56 | 17.29 | 15.13 |
| Sports goods | 0.15 | 0.12 | 0.13 |
| Chemicals & related products | 15.43 | 16.00 | 15.10 |
| Engineering goods | 16.41 | 18.41 | 18.66 |
| Electronic goods | 2.74 | 2.28 | 2.18 |
| Project goods | 0.09 | 0.06 | 0.13 |
| Textiles | 18.86 | 15.16 | 14.80 |
| Handicrafts | 0.70 | 0.43 | 0.40 |
| Carpets | 0.90 | 0.75 | 0.81 |
| Cotton raw incl. waste | 0.28 | 0.10 | 0.61 |
| Petroleum products | 5.54 | 8.57 | 11.21 |
| Unclassified exports | 4.07 | 2.66 | 2.94 |
| GRAND TOTAL | 100.00 | 100.00 | 100.00 |
| Total Exports in Rupees Crore | 293366.75 | 375339.53 | 454799.97 |
| US Dollar Exchange Rate | 45.9513 | 44.9315 | 44.2735 |
Given that the weight (%) of Petroleum crude and products in the total imports of India is 26.70, 27.87, and 30.87 in the years 2003-04, 2004-05, and 2005-06 respectively. What is the ratio of yearly difference in the export of Petroleum Products and import of Petroleum crude and products, in dollar terms, in the year 2005-06 versus 2004-05?
Show Hint
Convert each year's total imports and total exports to dollar terms using the given exchange rate, apply the petroleum weight percentages to get petroleum-specific import and export values, subtract export from import for each year, then divide the 2005-06 gap by the 2004-05 gap.
Updated On: Jul 13, 2026
- 1.36
- 1.38
- 1.46
- 1.48
Show Solution
The Correct Option is A
Solution and Explanation
Step 1: Write the ratio as one algebraic expression before plugging in numbers.
Let \(I_t\) and \(E_t\) stand for the dollar value of petroleum imports and petroleum exports in year t. The quantity we need is
\[ \text{Ratio} = \dfrac{I_{2005\text{-}06} - E_{2005\text{-}06}}{I_{2004\text{-}05} - E_{2004\text{-}05}} \]
where each \(I_t\) and \(E_t\) is found as (weight per cent) times (total trade in dollar terms for that year).
Step 2: Work out the 2005-06 numerator first.
Total imports in 2005-06 in dollar terms: \(\dfrac{630526.77}{44.2735} \approx 14241.68\), so \(I_{2005\text{-}06} = 0.3087 \times 14241.68 \approx 4396.4\).
Total exports in 2005-06 in dollar terms: \(\dfrac{454799.97}{44.2735} \approx 10272.42\), so \(E_{2005\text{-}06} = 0.1121 \times 10272.42 \approx 1151.5\).
Numerator: \(4396.4 - 1151.5 = 3244.9\)
Step 3: Work out the 2004-05 denominator the same way.
Total imports in 2004-05 in dollar terms: \(\dfrac{501064.54}{44.9315} \approx 11151.87\), so \(I_{2004\text{-}05} = 0.2787 \times 11151.87 \approx 3108.0\).
Total exports in 2004-05 in dollar terms: \(\dfrac{375339.53}{44.9315} \approx 8352.30\), so \(E_{2004\text{-}05} = 0.0857 \times 8352.30 \approx 715.8\).
Denominator: \(3108.0 - 715.8 = 2392.2\)
Step 4: Divide to get the final ratio.
\[ \text{Ratio} = \dfrac{3244.9}{2392.2} \approx 1.36 \]
Final Answer:
The petroleum trade gap in 2005-06 is about 1.36 times what it was in 2004-05. \[ \boxed{1.36} \]
Let \(I_t\) and \(E_t\) stand for the dollar value of petroleum imports and petroleum exports in year t. The quantity we need is
\[ \text{Ratio} = \dfrac{I_{2005\text{-}06} - E_{2005\text{-}06}}{I_{2004\text{-}05} - E_{2004\text{-}05}} \]
where each \(I_t\) and \(E_t\) is found as (weight per cent) times (total trade in dollar terms for that year).
Step 2: Work out the 2005-06 numerator first.
Total imports in 2005-06 in dollar terms: \(\dfrac{630526.77}{44.2735} \approx 14241.68\), so \(I_{2005\text{-}06} = 0.3087 \times 14241.68 \approx 4396.4\).
Total exports in 2005-06 in dollar terms: \(\dfrac{454799.97}{44.2735} \approx 10272.42\), so \(E_{2005\text{-}06} = 0.1121 \times 10272.42 \approx 1151.5\).
Numerator: \(4396.4 - 1151.5 = 3244.9\)
Step 3: Work out the 2004-05 denominator the same way.
Total imports in 2004-05 in dollar terms: \(\dfrac{501064.54}{44.9315} \approx 11151.87\), so \(I_{2004\text{-}05} = 0.2787 \times 11151.87 \approx 3108.0\).
Total exports in 2004-05 in dollar terms: \(\dfrac{375339.53}{44.9315} \approx 8352.30\), so \(E_{2004\text{-}05} = 0.0857 \times 8352.30 \approx 715.8\).
Denominator: \(3108.0 - 715.8 = 2392.2\)
Step 4: Divide to get the final ratio.
\[ \text{Ratio} = \dfrac{3244.9}{2392.2} \approx 1.36 \]
Final Answer:
The petroleum trade gap in 2005-06 is about 1.36 times what it was in 2004-05. \[ \boxed{1.36} \]
Was this answer helpful?
0
Top Questions on Data Interpretation
- The monthly salary for a person who follows the same expense pattern, but has a petrol expense of Rs 500 p.m., is:
- VITEEE - 2024
- General Aptitude
- Data Interpretation
- In a code language, 'TIGER' is written as 'JUISF'. How will 'EQUAL' be written in that language?
- VITEEE - 2025
- General Aptitude
- Data Interpretation
- Read the Passage carefully and answer the following questions.
An air conditioner (AC) unit has three operating modes: Eco, Normal, and Turbo. The power consumption in each mode is as follows: Eco mode consumes 1000 watts, Normal mode consumes 1200 watts, and Turbo mode consumes 1500 watts. Yesterday, the AC was in operation from 2 PM to 10 PM. From 2 PM to 6 PM it ran in Eco mode. From 6 PM to 8 PM, it ran in Normal mode. From 8 PM to 10 PM it ran in Turbo mode.- CAT - 2024
- Data Interpretation & Logical Reasoning (DILR)
- Data Interpretation
- Read the Passage carefully and answer the following questions
A health food store specializing in dietary supplements and whole grains recorded the following sales figures (in kilograms) for various food categories last month: Millets (M) = 500 kg at a cost price of 40/kg and selling price of 50/kg; Protein supplements (P) = 300 kg at a cost price of 80/kg and selling price of 100/kg; Vitamin supplements (V) = 200 kg at a cost price of 60/kg and selling price of 80/kg; Carbohydrates (C) = 600 kg at a cost price of 80/kg and selling price of 100/kg; Fats (F) = 100 kg at a cost price of 120/kg and selling price of 150/kg. Additionally, they sold 50 kg of mixed nuts (N) at a cost price of 100/kg and a selling price of 130/kg- CAT - 2024
- Data Interpretation & Logical Reasoning (DILR)
- Data Interpretation
- Want to practice more? Try solving extra ecology questions todayView All Questions
Questions Asked in XAT exam
Applicants have been shortlisted for interviews for some data analyst positions. Some of the applicants have advanced expertise in one or more fields among the following: data analysis, database handling and coding. The numbers of applicants with different advanced expertise are given in the 2 × 8 table below.
The number of applicants with advanced expertise in all three fields is given as x in the table, where x is a non-negative integer.
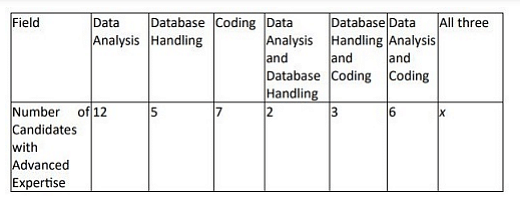
The number of applicants with advanced expertise in all three fields is given as x in the table, where x is a non-negative integer.
- XAT - 2024
- Data Interpretation