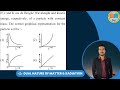
If \( \lambda \) and \( K \) are de Broglie wavelength and kinetic energy, respectively, of a particle with constant mass. The correct graphical representation for the particle will be:
If \( \lambda \) and \( K \) are de Broglie wavelength and kinetic energy, respectively, of a particle with constant mass. The correct graphical representation for the particle will be:
Show Hint


The Correct Option is A
Solution and Explanation
To represent the relationship between de Broglie wavelength \( \lambda \) and kinetic energy \( K \) for a particle of constant mass, we utilize the de Broglie wavelength formula: \(\lambda = \frac{h}{p}\). Here, \( h \) is Planck's constant and \( p \) is momentum. For a particle with mass \( m \) and kinetic energy \( K \), momentum is expressed as \(\sqrt{2mK}\). Substituting this into the de Broglie equation yields:
\[\lambda = \frac{h}{\sqrt{2mK}}\]
This equation indicates an inverse relationship between \(\lambda\) and \(\sqrt{K}\). Squaring both sides of the equation leads to:
\[\lambda^2 \propto \frac{1}{K}\]
A graph plotting \(\lambda^2\) against \(K\) will exhibit a hyperbolic curve.
The correct graphical representation is  , which illustrates \(\lambda^2\) decreasing as \(K\) increases, consistent with the derived inverse proportionality.
Learn with videos:
Top Questions on de broglie hypothesis
- A photon and an electron have the same energy \( E \). If \( \lambda_p \) is the wavelength of the photon and \( \lambda_e \) is the de Broglie wavelength of the electron, then the ratio \( \frac{\lambda_p}{\lambda_e} \) is:
- MHT CET - 2025
- Physics
- de broglie hypothesis
- A photon and an electron have the same energy \( E \). If \( \lambda_p \) is the wavelength of the photon and \( \lambda_e \) is the de Broglie wavelength of the electron, then the ratio \( \frac{\lambda_p}{\lambda_e} \) is:
- MHT CET - 2025
- Physics
- de broglie hypothesis
- Calculate the de Broglie wavelength of an electron moving with velocity $ 6 \times 10^6 \, m/s $. (Mass of electron $ m = 9.11 \times 10^{-31} \, kg $, Planck's constant $ h = 6.626 \times 10^{-34} \, Js $)
- BITSAT - 2025
- Physics
- de broglie hypothesis
- De-Broglie wavelength of an electron orbiting in the \(n = 2\) state of hydrogen atom is close to (Given Bohr radius = 0.052 nm):
- NEET (UG) - 2025
- Physics
- de broglie hypothesis
- Want to practice more? Try solving extra ecology questions todayView All Questions
