Question:hard
Choose correct graph of electric potential for uniformly charged hollow sphere.
Choose correct graph of electric potential for uniformly charged hollow sphere.
Updated On: Mar 30, 2026


Show Solution
The Correct Option is D
Solution and Explanation
To determine the graph of electric potential for a uniformly charged hollow sphere, we need to understand how the potential varies with distance from the center of the sphere.
For a uniformly charged hollow sphere:
- Outside the Sphere (r > R): The electric potential \(V\) at a distance \(r\) outside the sphere is given by: \(V = \frac{KQ}{r}\), where \(K\) is the Coulomb's constant and \(Q\) is the total charge of the sphere. The potential decreases with increasing \(r\).
- On the Surface of the Sphere (r = R): The potential remains constant and is equal to: \(V = \frac{KQ}{R}\).
- Inside the Sphere (r < R): The electric field inside a hollow sphere is zero due to the uniform distribution of charge. Thus, the potential remains constant and equal to the potential at the surface, \(V = \frac{KQ}{R}\).
The graph that correctly represents this behavior is a graph where:
- The potential is constant inside the sphere and up to the surface of the sphere.
- The potential decreases inversely proportional to \(r\) outside the sphere.
Thus, the correct graph is the one that shows a flat line from \(r = 0\) up to \(r = R\) (constant potential), and decreases inversely with \(r\) beyond \(r = R\). This matches the description of the image option:
This concludes that the correct graph for the electric potential of a uniformly charged hollow sphere is depicted in the above image.
Was this answer helpful?
0
Top Questions on Electric Potential And Potential Difference
- How is a voltmeter connected in the circuit to measure the potential difference between two points?
- CBSE Class X
- Science
- Electric Potential And Potential Difference
- A thin spherical shell is charged by some source. The potential difference between the two points C and P (in V) shown in the figure is:
(Take \(\frac{1}{4}\pi\epsilon_0 = 9 × 10⁹\)\(\frac{1}{4\pi\epsilon_0}=9\times10^9\) SI units)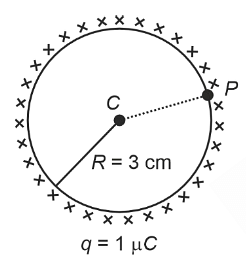
- NEET (UG) - 2024
- Physics
- Electric Potential And Potential Difference
- A charge of 10 coulomb is brought from infinity to a point \( P \) near a charged body and in this process 200 joules of work is done. Electric potential at point \( P \) is:
- JEECUP - 2024
- Physics
- Electric Potential And Potential Difference
Resistance of each side is $R$. Find equivalent resistance between two opposite points as shown in the figure.

- JEE Main - 2026
- Physics
- Electric Potential And Potential Difference
- Want to practice more? Try solving extra ecology questions todayView All Questions
