Question:medium
Which graph corresponds to an object moving with a constant negative acceleration and a positive velocity ?
Which graph corresponds to an object moving with a constant negative acceleration and a positive velocity ?
Updated On: Apr 1, 2026


Show Solution
The Correct Option is C
Solution and Explanation
To determine which graph corresponds to an object moving with a constant negative acceleration and a positive velocity, let's first understand the concepts involved:
- Constant Negative Acceleration: This means the velocity of the object is decreasing over time.
- Positive Velocity: This indicates that the object is moving in the positive direction (away from the origin).
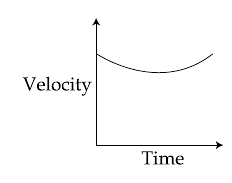
In a velocity-time graph, the velocity is plotted on the vertical axis and time on the horizontal axis. A negative acceleration would result in a downward-sloping line since the velocity decreases with time. A positive velocity implies that the graph should start above the time-axis (i.e., in the positive vertical region).
Now, let's examine the provided options:
- A graph that shows a straight line with a downward slope, starting from a positive value on the velocity axis, accurately depicts constant negative acceleration with a positive initial velocity.
Given this understanding, the correct graph is:

This graph correctly shows a linear decrease in velocity starting from a positive value, indicating a constant negative acceleration while maintaining a positive velocity.
Was this answer helpful?
3
Top Questions on Motion in a straight line
- A car starts from rest and accelerates uniformly at 3 m/s\textsuperscript{2. What will be its velocity after 5 seconds?}
- MHT CET - 2025
- Physics
- Motion in a straight line
- A projectile is fired with an initial velocity of 20 m/s at an angle of 30\(^\circ\) with the horizontal. Calculate the maximum height reached by the projectile.
- MHT CET - 2025
- Physics
- Motion in a straight line
- A 5 kg block is placed on a horizontal surface. A force of 10 N is applied to the block. The coefficient of friction between the block and the surface is 0.2. Find the acceleration of the block.
- MHT CET - 2025
- Physics
- Motion in a straight line
- A projectile is fired with an initial speed of \( 20 \, \text{m/s} \) at an angle of \( 30^\circ \) above the horizontal. Find the maximum height reached by the projectile.
- MHT CET - 2025
- Physics
- Motion in a straight line
- Want to practice more? Try solving extra ecology questions todayView All Questions
