Question:medium
A small metal sphere is falling through a viscous liquid. The variation of velocity (\(V\)) with time (\(t\)) is shown correctly in graph

A small metal sphere is falling through a viscous liquid. The variation of velocity (\(V\)) with time (\(t\)) is shown correctly in graph
Show Hint
The sphere speeds up from rest and its speed levels off at terminal velocity.
Updated On: Oct 1, 2026
- b
- a
- d
- c
Show Solution
The Correct Option is C
Solution and Explanation
Step 1: Approach
Write Newton's second law and read off the shape.
Step 2: Equation
$m\dfrac{dv}{dt}=mg-F_B-6\pi\eta rv$. The right side is largest at $v=0$ and decreases as $v$ grows, vanishing at $v_T=\dfrac{mg-F_B}{6\pi\eta r}$.
Step 3: Shape
Slope of the graph is $dv/dt$. It is largest at $t=0$ where $v=0$, and tends to zero when $v\to v_T$. This gives a curve rising from the origin and levelling off: graph (d).
Step 4: Option
Graph (d) is listed as option (C).
Final Answer:
The speed grows from zero and levels off at terminal velocity, which is graph (d), option (C). \[ \boxed{\text{graph (d)}} \]
Write Newton's second law and read off the shape.
Step 2: Equation
$m\dfrac{dv}{dt}=mg-F_B-6\pi\eta rv$. The right side is largest at $v=0$ and decreases as $v$ grows, vanishing at $v_T=\dfrac{mg-F_B}{6\pi\eta r}$.
Step 3: Shape
Slope of the graph is $dv/dt$. It is largest at $t=0$ where $v=0$, and tends to zero when $v\to v_T$. This gives a curve rising from the origin and levelling off: graph (d).
Step 4: Option
Graph (d) is listed as option (C).
Final Answer:
The speed grows from zero and levels off at terminal velocity, which is graph (d), option (C). \[ \boxed{\text{graph (d)}} \]
Was this answer helpful?
0
Top Questions on Viscosity
- An air bubble of diameter 6 mm rises steadily through a solution of density 1750kg / m3 at the rate of 0.35 cm/s. The co-efficient of viscosity of the solution (neglect density of air) is ____Pas (given, g = 10ms-2)
- JEE Main - 2023
- Physics
- Viscosity
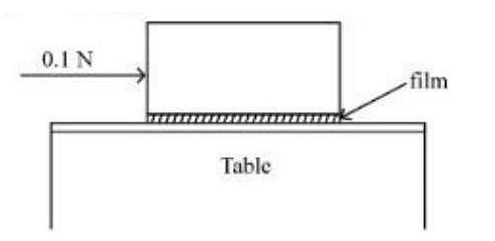
- A metal block of base area \(0.20 \,m^2\) is placed on a table, as shown in figure. A liquid film of thickness \(0.25\, mm\) is inserted between the block and the table. The block is pushed by a horizontal force of 0.1 N and moves with a constant speed. If the viscosity of the liquid is \(5.0×10^{−3}Pl\), the speed of block is ________ \(×10^{−3}m/s\)
- JEE Main - 2023
- Physics
- Viscosity
- The diameter of an air bubble which was initially 2 mm, rises steadily through a solution of density 1750 kg m–3 at the rate of 0.35 cms–1. The coefficient of viscosity of the solution is _______ poise (in nearest integer). (The density of air is negligible).
- JEE Main - 2022
- Physics
- Viscosity
A spherical ball is dropped in a long column of viscous liquid. The speed v of the ball as a function of time t may be best represented by

- BITSAT - 2010
- Physics
- Viscosity
- Want to practice more? Try solving extra ecology questions todayView All Questions