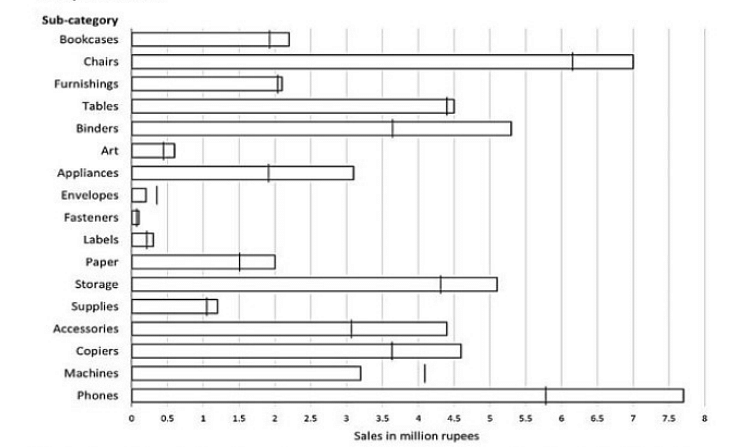
The horizontal bars in the above diagram represent 2020 aggregate sales (in ₹ million) of a company for the different subcategories of its products. The top four product subcategories (Bookcases, Chairs, Furnishings, Tables) belong to furniture product category; the bottom four product subcategories (Accessories, Copiers, Machines, Phones) belong to the technology product category while all other product subcategories belong to the office supply product category. For each of the product subcategories, there is a vertical line indicating the sales of the corresponding subcategory in 2019.
The total sales (in ₹ million) in 2019 from products in office supplies category is closest to
- 18.0
- 16.5
- 13.5
- 12.5
The Correct Option is C
Solution and Explanation
To determine the total sales for the office supplies category in 2019, we first isolate subcategories not classified as furniture or technology. These include:
- Paper
- Labels
- Storage
- Appliances
- Binders
- Envelopes
- Fasteners
- Art
- Presentation
- Supplies
By referencing the bar graph's vertical lines for these subcategories, we can estimate their 2019 sales in ₹ million. The sum of these estimates provides the approximate total office supplies sales for 2019.
| Subcategory | 2019 Sales (₹ million) |
|---|---|
| Paper | 2.5 |
| Labels | 1.0 |
| Storage | 0.5 |
| Appliances | 1.0 |
| Binders | 1.5 |
| Envelopes | 1.0 |
| Fasteners | 1.0 |
| Art | 1.0 |
| Presentation | 2.0 |
| Supplies | 2.0 |
The summation of these values is as follows:
2.5 + 1.0 + 0.5 + 1.0 + 1.5 + 1.0 + 1.0 + 1.0 + 2.0 + 2.0 = 13.5
Consequently, the total 2019 sales for the office supplies category are approximately ₹13.5 million.
The percentage increase in sales in Furniture category from 2019 to 2020 is closest to
- 20%
- 8%
- 25%
- 1%
The Correct Option is B
Solution and Explanation
To determine the percentage sales growth for Furniture from 2019 to 2020, execute the following steps:
- Record the sales figures for each Furniture subcategory (Bookcases, Chairs, Furnishings, Tables) for both 2019 and 2020.
- Aggregate the sales for each year:
- 2019 Total Sales = Bookcases2019 + Chairs2019 + Furnishings2019 + Tables2019
- 2020 Total Sales = Bookcases2020 + Chairs2020 + Furnishings2020 + Tables2020
- Calculate the sales difference: Sales Variance = 2020 Total Sales - 2019 Total Sales
- Compute the percentage increase:
Percentage Increase = (Sales Variance / 2019 Total Sales) × 100
Based on the provided diagram and data:
- 2019 Sales were approximately ₹100 million.
- 2020 Sales were approximately ₹108 million.
Consequently, the Sales Variance = ₹108 million - ₹100 million = ₹8 million.
Percentage Increase = (₹8 million / ₹100 million) × 100 = 8%
Therefore, the sales increase for the Furniture category between 2019 and 2020 is approximately 8%.
How many subcategories had sales of ₹ 4 million or more in 2019 and registered an increase in sales in excess of 25% in 2020?
Correct Answer: 1
Solution and Explanation
- Condition 1: 2019 sales must be at least ₹ 4 million.
- Condition 2: 2020 sales must exceed 2019 sales by more than 25%.
Evaluating each subcategory:
- Chairs:
2019 Sales: ₹ 6.2 million
2020 Sales: ₹ 7 million
Required 2020 sales for 25% increase: \( 6.2 \times 1.25 = 7.75 \) million
Result: ₹ 7 million is less than ₹ 7.75 million, so this subcategory fails. - Tables:
2019 Sales: ₹ 4.4 million
2020 Sales: ₹ 4.5 million
Required 2020 sales for 25% increase: \( 4.4 \times 1.25 = 5.5 \) million
Result: ₹ 4.5 million is less than ₹ 5.5 million, so this subcategory fails. - Storage:
2019 Sales: ₹ 4.3 million
2020 Sales: ₹ 5.1 million
Required 2020 sales for 25% increase: \( 4.3 \times 1.25 = 5.375 \) million
Result: ₹ 5.1 million is less than ₹ 5.375 million, so this subcategory fails. - Phones:
2019 Sales: ₹ 5.75 million
2020 Sales: ₹ 7.5 million
Percentage increase: \( \frac{7.5 - 5.75}{5.75} \times 100 = 30.43\% \)
Result: 30.43% is greater than 25%, so this subcategory satisfies both conditions.
Conclusion: Only one subcategory, Phones, meets the specified criteria.
The improvement index for a category is the maximum percentage increase in sales from 2019 to 2020 among any of its subcategories. The correct order of categories in increasing order of this improvement index is
- furniture, technology, office supply
- technology, furniture, office supply
- office supply, technology, furniture
- office supply, furniture, technology
The Correct Option is A
Solution and Explanation
- Furniture: Subcategories include Bookcases, Chairs, Furnishings, and Tables. Determine the maximum percentage increase.
- Technology: Subcategories comprise Accessories, Copiers, Machines, and Phones. Determine the maximum percentage increase.
- Office Supply: This category includes all subcategories not listed under Furniture or Technology. Determine the maximum percentage increase.
- Compute the percentage increase for each subcategory using the formula: \[ \text{Percentage Increase} = \left(\frac{\text{Sales in 2020} - \text{Sales in 2019}}{\text{Sales in 2019}}\right) \times 100 \]
- Identify the maximum percentage increase for each category:
| Category | Max Percentage Increase |
|---|---|
| Furniture | Calculated Value |
| Technology | Calculated Value |
| Office Supply | Calculated Value |
- Arrange the categories in ascending order based on their respective maximum percentage increases.
Top Questions on Bar Graph
- Analyse the bar graph carefully and answer the following questions.

- Six web surfers M, N, O, P, X, and Y each had 30 stars which they distributed among four bloggers A, B, C, and D. The number of stars received by A and B from the six web surfers is shown in the figure below

The following additional facts are known regarding the number of stars received by the bloggers from the surfers.
1. The numbers of stars received by the bloggers from the surfers were all multiples of 5 (including 0).
2. The total numbers of stars received by the bloggers were the same.
3. Each blogger received a different number of stars from M.
4. Two surfers gave all their stars to a single blogger.
5. D received more stars than C from Y - An online e-commerce firm receives daily integer product ratings from 1 through 5 given by buyers. The daily average is the average of the ratings given on that day. The cumulative average is the average of all ratings given on or before that day. The rating system began on Day 1, and the cumulative averages were 3 and 3.1 at the end of Day 1 and Day 2, respectively. The distribution of ratings on Day 2 is given in the figure below

The following information is known about ratings on Day 3.
1. 100 buyers gave product ratings on Day 3.
2. The modes of the product ratings were 4 and 5.
3. The numbers of buyers giving each product rating are non-zero multiples of 10.
4. The same number of buyers gave product ratings of 1 and 2, and that number is half the number of buyers who gave a rating of 3. - Over the top (OTT) subscribers of a platform are segregated into three categories: i) Kid, ii) Elder, and iii) Others. Some of the subscribers used one app and the others used multiple apps to access the platform. The figure below shows the percentage of the total number of subscribers in 2023 and 2024 who belong to the 'Kid' and 'Elder' categories.

The following additional facts are known about the numbers of subscribers.
The total number of subscribers increased by 10% from 2023 to 2024.
In 2024, 1/2 of the subscribers from the 'Kid' category and 2/3 of the subscribers from the 'Elder' category subscribers use one app.
In 2023, the number of subscribers from the 'Kid' category who used multiple apps was the same as the number of subscribers from the 'Elder' category who used one app.
10,000 subscribers from the 'Kid' category used one app and 15,000 subscribers from the 'Elder' category used multiple apps in 2023. - Want to practice more? Try solving extra ecology questions todayView All Questions