Comprehension
The following table showing the entire population of a city during 2017–2022.The following line diagram shows the percentage of people who are affected by different virus.
Question: 1
By what percent women are more affected by virus than men in 2020?
By what percent women are more affected by virus than men in 2020?
Show Hint
In percentage comparison questions, always check whether the comparison is with the base value or total value.
Updated On: Jul 15, 2026
- \(16\frac{2}{3}\)
- \(22\frac{1}{2}\)
- \(13\frac{1}{3}\)
- \(18\frac{2}{3}\)
Show Solution
The Correct Option is D
Solution and Explanation
Was this answer helpful?
0
Question: 2
In 2022, what is the ratio of the number of women to children that are affected by virus?
In 2022, what is the ratio of the number of women to children that are affected by virus?
Show Hint
For ratio questions involving fractions, convert them into improper fractions first and then simplify.
Updated On: Jul 15, 2026
- \(18:7\)
- \(8:1\)
- \(25:3\)
- \(27:4\)
Show Solution
The Correct Option is C
Solution and Explanation
Was this answer helpful?
0
Question: 3
Let \(a\) denote the total number of males and children affected by virus and \(b\) be the total number of women affected by virus. Then \(a\) is less than \(b\) by what percentage?
Let \(a\) denote the total number of males and children affected by virus and \(b\) be the total number of women affected by virus. Then \(a\) is less than \(b\) by what percentage?
Show Hint
For total comparison questions, first sum category-wise carefully before applying percentage formula.
Updated On: Jul 15, 2026
- \(20\)
- \(25\)
- \(33\frac{1}{3}\)
- \(22\frac{1}{2}\)
Show Solution
The Correct Option is A
Solution and Explanation
Was this answer helpful?
0
Top Questions on Data Analysis
- The schematic diagram below shows 12 rectangular houses in a housing complex. House numbers are mentioned in the rectangles representing the houses. The houses are located in six columns - Column-A through Column-F, and two rows - Row-1 and Row- 2 . The houses are divided into two blocks - Block XX and Block YY. The diagram also shows two roads, one passing in front of the houses in Row-2 and another between the two blocks.

Some of the houses are occupied. The remaining ones are vacant and are the only ones available for sale.
The road adjacency value of a house is the number of its sides adjacent to a road. For example, the road adjacency values of C2, F2, and B1 are 2, 1, and 0, respectively. The neighbour count of a house is the number of sides of that house adjacent to occupied houses in the same block. For example, E1 and C1 can have the maximum possible neighbour counts of 3 and 2, respectively.
The base price of a vacant house is Rs. 10 lakhs if the house does not have a parking space, and Rs. 12 lakhs if it does. The quoted price (in lakhs of Rs.) of a vacant house is calculated as (base price) + 5 × (road adjacency value) + 3 × (neighbour count).
The following information is also known.
1. The maximum quoted price of a house in Block XX is Rs. 24 lakhs. The minimum quoted price of a house in block YY is Rs. 15 lakhs, and one such house is in Column-E.
2. Row-1 has two occupied houses, one in each block.
3. Both houses in Column-E are vacant. Each of Column-D and Column-F has at least one occupied house.
4. There is only one house with parking space in Block YY. - A visa processing office (VPO) accepts visa applications in four categories - US, UK, Schengen, and Others. The applications are scheduled for processing in twenty 15-minute slots starting at 9:00 am and ending at 2:00 pm. Ten applications are scheduled in each slot.
There are ten counters in the office, four dedicated to US applications, and two each for UK applications, Schengen applications and Others applications. Applicants are called in for processing sequentially on a first-come-first-served basis whenever a counter gets freed for their category. The processing time for an application is the same within each category. But it may vary across the categories. Each US and UK application requires 10 minutes of processing time. Depending on the number of applications in a category and time required to process an application for that category, it is possible that an applicant for a slot may be processed later.
On a particular day, Ira, Vijay and Nandini were scheduled for Schengen visa processing in that order. They had a 9:15 am slot but entered the VPO at 9:20 am. When they entered the office, exactly six out of the ten counters were either processing applications, or had finished processing one and ready to start processing the next.
Mahira and Osman were scheduled in the 9:30 am slot on that day for visa processing in the Others category.
The following additional information is known about that day.
1. All slots were full.
2. The number of US applications was the same in all the slots. The same was true for the other three categories.
3. 50% of the applications were US applications.
4. All applicants except Ira, Vijay and Nandini arrived on time.
5. Vijay was called to a counter at 9:25 am. - There are nine boxes arranged in a 3×3 array as shown in Tables 1 and 2. Each box contains three sacks. Each sack has a certain number of coins, between 1 and 9, both inclusive.
The average number of coins per sack in the boxes are all distinct integers. The total number of coins in each row is the same. The total number of
coins in each column is also the same.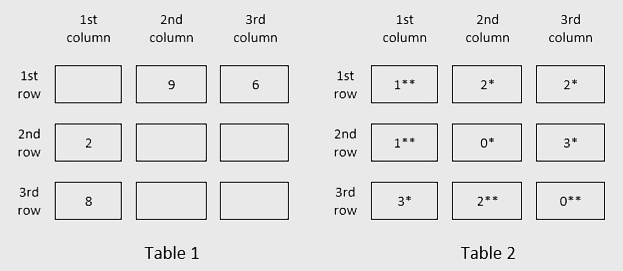
Table 1 gives information regarding the median of the numbers of coins in the three sacks in a box for some of the boxes. In Table 2 each box has a number which represents the number of sacks in that box having more than 5 coins. That number is followed by a * if the sacks in that box satisfy exactly one among the following three conditions, and it is followed by ** if two or more of these conditions are satisfied.
i) The minimum among the numbers of coins in the three sacks in the box is 1.
ii) The median of the numbers of coins in the three sacks is 1.
iii) The maximum among the numbers of coins in the three sacks in the box is 9. - There are nine boxes arranged in a 3×3 array as shown in Tables 1 and 2.

Each box contains three sacks. Each sack has a certain number of coins, between 1 and 9, both inclusive.
The average number of coins per sack in the boxes are all distinct integers. The total number of coins in each row is the same.
The total number of coins in each column is also the same. Table 1 gives information regarding the median of the numbers of coins in the three sacks in a box for some of the boxes. In Table 2 each box has a number which represents the number of sacks in that box having more than 5 coins. That number is followed by a * if the sacks in that box satisfy exactly one among the following three conditions, and it is followed by ** if two or more of these conditions are satisfied.
i) The minimum among the numbers of coins in the three sacks in the box is 1.
ii) The median of the numbers of coins in the three sacks is 1.
iii) The maximum among the numbers of coins in the three sacks in the box is 9. - Want to practice more? Try solving extra ecology questions todayView All Questions
