Question:medium
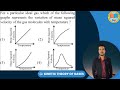
For a particular ideal gas, which of the following graphs represents the variation of mean squared velocity of the gas molecules with temperature?
For a particular ideal gas, which of the following graphs represents the variation of mean squared velocity of the gas molecules with temperature?
Show Hint
Remember that in ideal gases, the mean squared velocity is directly proportional to temperature.
Updated On: Apr 19, 2026


Show Solution
The Correct Option is C
Solution and Explanation
The mean squared velocity \( \langle v^2 \rangle \) of an ideal gas is expressed as \( \langle v^2 \rangle = \frac{3kT}{m} \), where \( k \) is the Boltzmann constant, \( T \) is the temperature, and \( m \) is the mass of the gas molecules.
Step 1: This equation indicates a direct proportionality between mean squared velocity and temperature.
Step 2: Consequently, the appropriate graphical representation is a straight line exhibiting a positive gradient.
Final Conclusion: The graph depicting a linear correlation between mean squared velocity and temperature aligns with Option (3).
Was this answer helpful?
0
Learn with videos:
Top Questions on The Kinetic Theory of Gases
- The temperature of a gas having \( 2.0 \times 10^{25} \) molecules per cubic meter at 1.38 atm (Given, \( k = 1.38 \times 10^{-23} \, \text{JK}^{-1} \)) is:
- JEE Main - 2024
- Physics
- The Kinetic Theory of Gases
- The average kinetic energy of a monatomic molecule is 0.414 eV at temperature: (Use \( k_B = 1.38 \times 10^{-23} \, \text{J/mol-K} \))
- JEE Main - 2024
- Physics
- The Kinetic Theory of Gases
- The parameter that remains the same for molecules of all gases at a given temperature is :
- JEE Main - 2024
- Physics
- The Kinetic Theory of Gases
- The speed distribution for a sample of \(N\) gas particles is shown below. \(P(v) = 0\) for \(v > 2v_0\). How many particles have speeds between \(1.2v_0\) and \(1.8v_0\)?

- WBJEE - 2024
- Physics
- The Kinetic Theory of Gases
- Want to practice more? Try solving extra ecology questions todayView All Questions
