A thick current carrying cable of radius $'R'$ carries current $'I'$ uniformly distributed across its cross-section. The variation of magnetic field $B ( r )$ due to the cable with the distance $'r'$ from the axis of the cable is represented by :


The Correct Option is C
Solution and Explanation
To solve this problem, we need to determine how the magnetic field \(B(r)\) varies with distance \(r\) from the axis of a thick cable carrying a uniformly distributed current \(I\).
The situation involves using Ampère's Law, which states that the line integral of the magnetic field \(B\) around a closed path is equal to \(\mu_0\) times the current enclosed by that path:
According to Ampère’s Law:
\[\oint \mathbf{B} \cdot d\mathbf{l} = \mu_0 I_{\text{enc}}\]where \(I_{\text{enc}}\) is the current enclosed by the loop.
- If \(r < R\) (inside the cable):
- The current density \(J\) is uniform, thus \(J = \frac{I}{\pi R^2}\).
- The current enclosed, \(I_{\text{enc}} = J \cdot \pi r^2 = \frac{I r^2}{R^2}\).
- Apply Ampère’s Law: \(B \cdot 2\pi r = \mu_0 \frac{I r^2}{R^2}\).
- Thus, \(B = \frac{\mu_0 I r}{2\pi R^2}\).
- If \(r \ge R\) (outside the cable):
- All the current \(I\) is enclosed by the Amperian loop.
- Apply Ampère’s Law: \(B \cdot 2\pi r = \mu_0 I\).
- Thus, \(B = \frac{\mu_0 I}{2\pi r}\).
The correct plot of \(B(r)\) vs \(r\) should show:
- For \(r < R\), \(B \propto r\) (linearly increasing).
- For \(r \ge R\), \(B \propto \frac{1}{r}\) (hyperbolically decreasing).
Thus, the correct choice is the plot which matches these characteristics. From the options provided, the correct visual representation is:
This plot accurately demonstrates the linear increase of \(B(r)\) inside the cable and the hyperbolic decrease outside it.
Top Questions on Amperes circuital law
- A coil has a resistance of \( 30 \, \Omega \) and an inductive reactance of \( 20 \, \Omega \) at 50 Hz frequency. If an AC source of 200 V and 100 Hz is connected across the coil, then how much current will flow through the coil?
- MHT CET - 2024
- Physics
- Amperes circuital law
- In a series LCR circuit connected to an AC source, at resonance, the current is maximum because:
- MHT CET - 2024
- Physics
- Amperes circuital law
Consider the circuit shown :
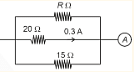 The ammeter reads 0.9 A. Value of R is
- JEE Main - 2024
- Physics
- Amperes circuital law
- A transistor is used in an amplifier circuit in common emitter mode. If the base current changes by 100μA, it brings a change of 10mA in collector current. If the load resistance is 2kΩ and input resistance is 1kΩ, the value of power gain is \(x×10^4\). The value of x is _______.
- JEE Main - 2022
- Physics
- Amperes circuital law
- Want to practice more? Try solving extra ecology questions todayView All Questions

