Which among the following option is the correct graphical representation of Boyle's Law?


The Correct Option is B
Solution and Explanation
To solve the question of identifying the correct graphical representation of Boyle's Law, we need to understand the law itself.
Boyle's Law states that the pressure of a given mass of gas is inversely proportional to its volume, provided the temperature remains constant. Mathematically, this can be expressed as:
\(PV = k\), where \(P\) is the pressure, \(V\) is the volume, and \(k\) is a constant.
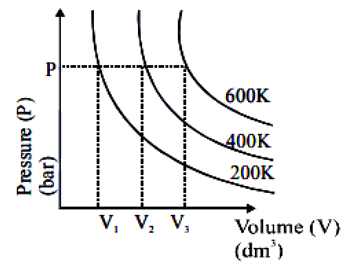
Since \(P \propto \frac{1}{V}\), the graph of pressure (P) versus volume (V) should be a hyperbola, indicating an inverse relationship.
Now, let's evaluate the given options and identify which graph fits this relationship:
- The correct graph for Boyle's Law should display a downward-sloping curve, which represents an inverse relationship.
On reviewing the given options, the correct graph depicting Boyle's Law is:
This graph shows that as the volume decreases, the pressure increases, and vice versa, which is consistent with Boyle's Law.
Therefore, The correct option is (B)
Top Questions on States of matter
- What is the oxidation state of Fe in \( \mathrm{Fe_3O_4} \)?
- MHT CET - 2024
- Physics
- States of matter
- Convert 72 degrees Celsius to Fahrenheit.
- MHT CET - 2024
- Physics
- States of matter
- How many lattice points are there in a Body-Centered Cubic (BCC) structure?
- MHT CET - 2024
- Chemistry
- States of matter
- What is the molar mass of a gas, if 2.5 g of the gas occupies 1.12 L at STP?
- MHT CET - 2025
- Chemistry
- States of matter
- Want to practice more? Try solving extra ecology questions todayView All Questions

